Putting two fingers up to anal Covid testing
Due warning: ‘The Internet’ is not a medical expert. This post is not medical advice, but is a discussion of some of the nuances of medical testing thinly veiled as a discussion about sniffing poo.
In times of difficulty and worry, there are two things we can rely on: dark humour, and bad memes. Covid is no different. Last week, when Spain announced they’d been using a COVID PCR test via an anal swab, the internet exploded with comedy depictions of this new test (see below).
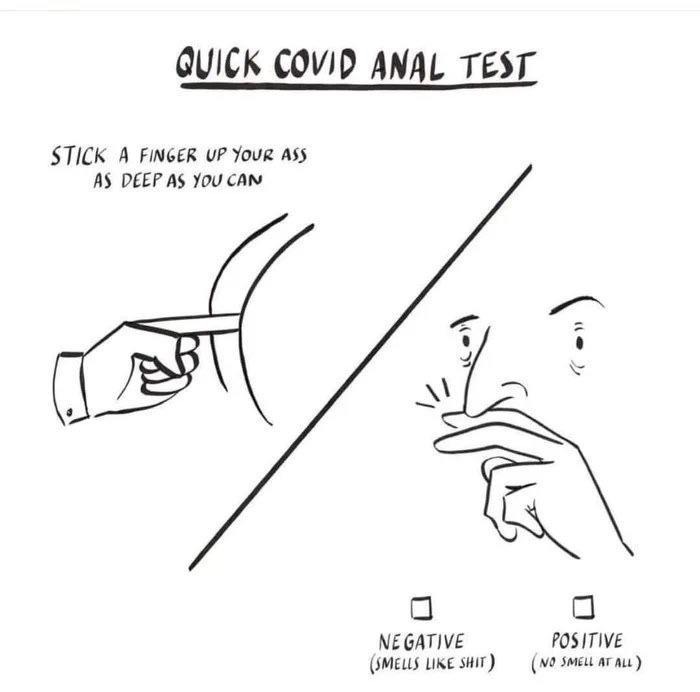
This has been going around, and I’m afraid I have no idea who first drew it. Whoever did has won the internet for today.
The value of finger sniffing
Now, a normal person would see that meme laugh and then move on with their life. Unfortunately, I am not normal. The first question I asked was:
“I wonder if that would work?”
Fortunately, I’ve been looking at how we value imperfect tests like lateral flow immunoassays (LFIAs), so I had some neat scripts to show the value of a test if we know its sensitivity, specificity, and the base rate of illness.
If we know the what now?
Sensitivity and specificity are two measures of how good a diagnostic test is. The sensitivity of a test tells us what proportion of people with an illness are correctly identified by the test. The specificity tells us the proportion of people without the illness that are correctly identified as not having the illness by the test. They’re usually expressed as either percentages or values from 0 to 1, and bigger numbers are better. Here’s a table to help make sense of that:
| Sensitivity and specificity | True illness state | ||
|---|---|---|---|
| Have the illness | Don’t have illness | ||
| Test result | Positive test | Sensitivity (true positive) |
1-specificity (false positive) |
| Negative test | 1-sensitivity (false negative) |
Specificity (true negative) |
|
For example, if we had a test that was 80% sensitive and 90% specific, the table would look like this:
| Example of sensitivity and specificity | True illness state | ||
|---|---|---|---|
| Have the illness | Don’t have illness | ||
| Test result | Positive test | 0.8 | 1-0.9=0.1 |
| Negative test | 1-0.8=0.2 | 0.9 | |
And the base rate?
We have to be careful with tables of sensitivity and specificity because they can be misleading. A big issue in medical testing (and in screening programmes) is the fact that how well your test does depends on how many people in the population have the illness. Imagine you have two towns of 100,000 people but different illness prevalence and we’re using the test above:
| Testing in a very high prevalence population | True illness state | ||
|---|---|---|---|
| Have the illness N=50,000 |
Don’t have illness N=50,000 |
||
| Test result | Positive test | 50,000×0.8 = 40,000 | 50,000×0.1 = 5,000 |
| Negative test | 50,000×0.2 = 10,000 | 50,000×0.9 = 45,000 | |
| Testing in a lower prevalence population | True illness state | ||
|---|---|---|---|
| Have the illness N=1,000 |
Don’t have illness N=99,000 |
||
| Test result | Positive test | 1,000×0.8 = 800 | 99,000×0.1 = 9,900 |
| Negative test | 1,000×0.2 = 200 | 99,000×0.9 = 89,100 | |
In the higher prevalence population, our test gives a correct result in 85,000 out of 100,000 people (85% success). In the lower prevalence population, our test gives a correct result in 89,900 out of 100,000 people (89.9% success).
We call the frequency of the illness in the population the base rate. The base rate matters in a lot of statistical situations. In this case it matters because there is an imbalance between the sensitivity and the specificity of the test, which there almost always is. Which test we prefer in a given population will depend on sensitivity, specificity, base rate, and the consequences of a false positive and false negative result.
Fine, so would our finger-sticking faecal test work?
Well, let’s see. We need some sort of estimate for the sensitivity and specificity of finger-sniffing, and we need to know the base rate of Covid in our population.
Sensitivity first.
To work this out, we need to know what proportion of people with Covid have smell loss. Estimates for this vary quite a bit, with Mullol et al reporting literature estimates of between 5 and 95%. We’re looking for something we can use in a general population sample (i.e including people with no other symptoms) and we’re interested in a severity of smell loss that is sufficient to affect our finger-sniffing, but it doesn’t need to be a complete loss of the smell sense (known as anosmia, brilliantly). For reasons that should be obvious to any right-thinking person, we are not concerned with loss of the sense of taste, which is sometimes considered alongside smell loss. Thank god, in this case.
The Office for National Statistics in England has a population survey for Covid that includes questions about symptoms. It deliberately includes a community sample, so will include people without any other symptoms. It may have a bias towards lower severity illness because it excludes hospitals, care homes etc. The proportion of people testing positive who had smell loss was between 14 and 20%. A meta-analysis by Tong et al, published quite early on in the pandemic, gave a pooled estimate of 52.73% (95% CI, 29.64%-75.23%) but found statistically significant differences between studies. Given all this, I reckon a sensitivity estimate for our purpose of 20%-60% seems reasonable.
Specificity is tricky too. Mullol et al note that smell dysfunction is pretty common in other conditions, including colds, and I’m sure we can all see that this is true. However, most of us don’t have other illnesses most of the time. Haehner et al looked at the specificity of smell loss in Covid by looking at people presenting for testing and estimated a specificity of 97%. That seems pretty high to me, but a lot of the reports of smell loss are of quite a distinct presentation that is more obvious than the reduced smell we get with colds and things, so we’ll take it as a decent first approximation.
This isn’t looking great
No, it isn’t is it? Let’s get some base rate data. In England, the Office for National Statistics (ONS) does a routine population survey, as we’ve already mentioned, so we can get a crude estimate of the base rate for where this author lives. If you know a source for your area, why not join in with the sums.
I’m currently in England, and I’m in the community. I’m over 35 and I’m not currently patient facing. The ONS estimate for England is that, on the 9th January, around 1.77% of people like me had Covid. You can get regional breakdowns as well if that’s more useful.
If I use an imaginary 100,000 people like me with a base rate of 1.77%, a sensitivity of 40% and a specificity of 97%, the results table looks something like this (with lots of uncertainty around those estimates!):
| Guesstimated performance of the finger sniff test | True illness state | ||
|---|---|---|---|
| Have the illness N=1,770 |
Don’t have illness N=98,230 |
||
| Test result | Positive test | 1,770×0.4 = 708 | 98,230×0.03 = 2,947 |
| Negative test | 1,770×0.6 = 1,062 | 98,230×0.97 = 95,283 | |
It’s not great; we miss over 1,000 cases in every 100,000 people who sniff their fingers.
How does that compare to PCR tests?
It should come as no surprise that PCR tests are a lot better.
UK Government data suggests that PCR tests have a sensitivity of around 83.0% and a specificity 99.3%. This is broadly consistent with estimates from the US and from published information in the Lancet, but the main uncertainty comes from differences between how well a test can do in ideal conditions (its analytic performance) and real-world performance in the clinic. There is still uncertainty around this, but test performance is very good. Taking the same (imaginary) sample, this is what the PCR results look like:
| Approximate performance of PCR testing | True illness state | ||
|---|---|---|---|
| Have the illness N=1,770 |
Don’t have illness N=98,230 |
||
| Test result | Positive test | 1,770×0.83 = 1,469 | 98,230×0.007 = 688 |
| Negative test | 1,770×0.17 = 301 | 98,230×0.993 = 97,542 | |
So, sniffing your finger is a bad idea?
Yes, it is. It’s very unhygienic and faecal-oral transmission of Covid (well, SARS-CoV-2) does occur. However, if you are in the habit of finger-sniffing, any change you notice could still be useful. It’s just not a sensible replacement for PCR testing.
The key to understanding this is to look at those errors. Even though the PCR tests are very good, they can miss things and they can also give false positives. In practice, we can use things like multiple testing to reduce certain types of errors, but what we actually do is to try and enrich our sample.
Enriching? Count me in!
By enriching, we mean using a pre-screen to screen in people who are more likely to have Covid so that we have a better chance of capturing true cases without ending up treating people who have no illness (the false positive cases).
The finger-sniff test could be part of that pre-screening. Indeed, when loss of a sense of smell was identified as a recurring sign of illness, many countries added it to their list of symptoms that would make people eligible for a test.
Using the tables we have above, we started with a population where the likelihood of any given person having Covid was 1.77%. If we insisted that people had to have loss of smell to get a test, we would increase that percentage rate to 708/(708+2,947), which is 19.37%. We could then use a PCR test on those individuals and capture some cases without having to test everyone all the time.
If we just used the smell test we’d miss a lot of people with illness, so we tend to include a range of symptoms. Individually, these symptoms may have a low sensitivity. However, when taken together (particularly if we have symptoms that are quite specific) they can do quite a lot of the pre-filtering allowing us to capture a decent proportion of the true cases while being logistically possible and managing the difficulties associated with isolating.
We can actually model this fairly reliably if we know the joint probabilities of displaying the various symptoms of Covid. A joint probability is just like a normal probability, but also includes an estimate of having more than one symptom.
But what about the ones we miss?
You may be looking at the false negative rates and getting quite nervous. You should be wary of this; public health experts certainly are. This is where things like physical distancing and contact tracing become really important.
Every single case has come from somewhere. Sometimes, it is not possible to identify where they have come from, but every infection requires viral transmission to have occurred. This means that infections tend to cluster. We know that, even with very good tests we will miss some cases, but we can increase our risk of managing the societal risk by catching clusters instead of individuals. Even if our testing system only captures a proportion of cases, we can manage spread by treating contacts of identified cases as potential cases whether they are showing symptoms or not. Importantly, for this to work you need to isolate people even if they test negative.
The ONS survey data suggest that around 50% of individuals testing positive in the community (commonly reported as about a third of cases overall) do not have any current reported symptoms and so could be missed or detected late by a programme that relied solely on testing. However, with contact tracing and other measures to reduce the risk of transmission of illness generally, we can increase our chance that those individuals missed do not pass on illness to other people.
Overall, the actions to reduce Covid spread and manage risk are layered together to increase our chance of identifying true cases and reduce the impact on the general population.
So, if you stop being able to smell excrement covered fingers, it’s probably a good idea to isolate yourself and get a proper test. And, you should really have been thinking that any strong smell could work as a pre-test.