Communicating risk with Covid testing the Bayesian way
This post is in response to the increased use of lateral flow tests for Covid screening. I’ve had a number people asking about these. This includes people providing diagnostic tests who are being asked to provide lateral flow tests and are nervous about how to do so ethically.
Seeing as we’re talking about ethics, let’s start with a disclaimer:
This post does not contain health advice. It can’t because I don’t have complete, up-to-date, information about your individual risk of Covid or the sensitivity and specificity of any given test. What it does provide is a framework for thinking about imperfect tests and some ideas about how we can communicate test results in a complex, changeable environment.
I talk a lot about Bayesian approaches to statistics and, most of the time, I’m talking about things which are pretty well covered elsewhere. Today, I’m sticking my head out a bit. I’m going to be applying Bayesian principles to medical screening (which is pretty standard), but I’ll be talking about tests that have significant weaknesses. I think this is more interesting because it reaches into the heart of Bayesian analysis, which is all about handling uncertainty. It also brings out the importance of the relationship between human psychology and uncertainty when balancing risk.
For those of you in a rush, instead of being told just the sensitivity and specificity of a test, imagine being told, as an employer:
“Of your 200 staff, we estimate that around 6 have Covid. Of these, we would expect to identify 5 using Test X. Of the 194 without Covid, we would expect around 10 to have to isolate unnecessarily, but the rest could work”.
If you’re one of the people who tests negative, instead of being told “You’ve got a negative test. It’s reasonably reliable, but you could still have Covid”, imagine being told:
“In this area, we believe that between 1 in every 31 to 39 people in the community have Covid. Of the people who get a negative test result with Test X, 1 in every 295 to 379 people are expected to actually have Covid. You’d be unlucky to have Covid and test negative, but it does happen. Amongst the people we’re screening in your workplace today, we’d expect to miss 1 or 2 who do have Covid”.
Sound like a good idea? Let’s get started.
What’s the problem?
First of all: There is no real issue with the main PCR tests used for the diagnosis of those showing symptoms. Most people would prefer not to have to run PCR analyses for every person, but the tests work very well.
There are some potential issues with the lateral flow immunoassays (LFIAs) which are being used under some circumstances to provide rapid testing for people. They are particularly used in general population screening at schools and workplaces where people are not showing Covid symptoms.
The main concern is that these may have a low sensitivity to illness, even though they show good specificity. What this means is that a positive test result may be a good indicator that you do have Covid, but that a negative test is inconclusive. In other words, a person who has Covid has a high chance of getting a negative test result.
Are lateral flow tests a waste of time?
That depends. There is potential value in reducing the spread of Covid-19 by identifying people without symptoms who would not present themselves for PCR testing. Rapid testing has the potential to allow the identification of cases early, reducing the spread of illness and so the burden of illness and death.
The decision as to whether lateral flow tests are worthwhile depends on quite complex considerations about things such as:
- The rate of illness in the population
- The impact of illness on the population
- The consequences of self-isolation to peoples’ wellbeing
- The behaviour of people following test results
These will vary from place to place and over time, so I’m not going to say whether lateral flow tests are advisable for any specific group now. What I am going to talk about is how we manage the behavioural risks associated with them.
No such thing as a negative test
The behavioural risk is a consequence of the difference between the sensitivity and the specificity of the tests. We are used to hearing about ‘positive’ and ‘negative’ test results, and our behaviour often mirrors that binary choice.
If we’re about to meet up with elderly relatives in a care home offering lateral flow testing, we would (I hope!) cancel the visit if we tested positive. The issue is that, if we test negative but the test has a low sensitivity, we may feel a false sense of security and visit those vulnerable relatives when the actual risk of us having illness is still quite high.
Contingent probability and the likelihood of having Covid
If you asked a random person in the street whether they thought they had Covid, the majority of people would say ‘no’. If you asked people the likelihood that they had Covid, the majority would give you a lower number than they should. If you ask people what the risk of someone else having Covid is, they are likely to estimate that risk as higher than their own risk.
A small number of people may know the diagnosis rates in their area and quote that, which is a pretty good effort. But it’s definitely an underestimate because a proportion of individuals show no symptoms.
If you live in England, you can look at the Office for National Statistics survey for Covid and get a much better answer. For example, as of the 16th January the estimated prevalence of Covid in England was 1.86% with a credible range of 1.74%-1.99%.
Percentages are difficult to understand, but that’s one person in every 50-57 having Covid during that period. The small print on the data tells us that this is people in the community, so not hospitals or care homes.
I’m stating these statistics because we’ll need them in a moment, but also because our behaviour needs to be based on a realistic estimate of risk. The majority of us, myself included, do not go around with an accurate idea of our individual risk of being ill in our head. This is why so much public health messaging is around assuming that you have illness. 1 in every 50-57 people having Covid means that there’s a pretty high chance of being exposed to someone with Covid if you go to a busy supermarket or catch a train. That’s why physical distancing and hygiene measures are so important; we can’t simply remove exposure risk without extreme effects on public life once a disease has a high prevalence.
When we talk about interpreting test results, we are talking about contingent probability. Specifically, we are interested in the probability that you have the illness given that you have a positive (or negative) test result. That probability relies on both the characteristics of the test and the base rate of illness in the population.
Balancing awareness and fear
Remember, this is not your risk of getting seriously ill. It is an estimate of the risk that you have a Covid infection. It won’t be exactly right and your risk of serious illness is vastly lower.
If you’re minimising your exposure to illness, you may have a lower individual risk, but the risk amongst a mixed group of people is probably around that level. If you’re in London or the North East, our best estimate of your risk is higher. If you’re in the South West it is (at the time of writing) rather lower.
While your risk of getting serious ill is vastly lower than this, people with no symptoms can pass on illness. If your individual risk is (on average) just below 1 in 50, the importance of physical distancing and cleaning in a workplace of 200 people becomes really clear. The benefits of home-working, where possible, also become obvious.
As has been the case throughout this pandemic, the best way to manage risk overall is to reduce transmission.
What about the tests?
I work with medical evidence all the time, and I’m not sure what the sensitivity and specificity of different tests are. There is some literature, but the numbers I’ll use here should be treated with a pinch of salt. Any organisation providing testing should be able to give you estimates for the tests they are using alongside a reference to the research on which that estimate is based.
I’ve written before about Bayesian statistics. Bayes’ theorem provides a neat way of updating our beliefs based on available evidence and diagnostic testing is often used to illustrate it. Bayes’ theorem looks like this:
![\[{P(H|E)} = {{P(E|H) \times P(H)} \over {P(E)}}\]](https://monkeyglandin.com/wp-content/ql-cache/quicklatex.com-16a9b9a5b803d90b3b707a9fa5815117_l3.png "Rendered by QuickLaTeX.com")
For our situation, we can express this as:
![\[{P(Covid|Positive \, test)} = {{P(Positive \, test|Covid) \times P(Covid)} \over {{P(Positive \, test|Covid) \times P(Covid)} \plus {P(Positive \, test|Not \, Covid) \times P(Not \, Covid)}}}\]](https://monkeyglandin.com/wp-content/ql-cache/quicklatex.com-720684297fe9b30ba732b88b7a588a4f_l3.png "Rendered by QuickLaTeX.com")
![\[{P(Covid|Negative\, test)} = {{P(Negative\, test|Covid) \times P(Covid)} \over {{P(Negative\, test|Covid) \times P(Covid)} \plus {P(Negative\, test|Not \, Covid) \times P(Not \, Covid)}}}\]](https://monkeyglandin.com/wp-content/ql-cache/quicklatex.com-74d9feeb3ed90e702ec5b47282ca6296_l3.png "Rendered by QuickLaTeX.com")
Have a look at the linked article or my YouTube channel if you want to see where the equation has come from (it’s pretty simple really). The cool thing is that we can use it to create a useful Python function that can give us an estimate of our risk of having Covid if we get a positive or negative test result.
I’m including this function in case you want to play around with it yourself. If coding isn’t your thing, just skip on.
# Function to calculate the posterior probability of having Covid if I get a positive or negative test result
def TestResult(sensitivity, specificity, prior):
    # Calculate all the various probabilities
    P_Covid = prior
    P_notCovid = 1-prior
    P_Positive_given_Covid = sensitivity
    P_Positive_given_notCovid = 1 - specificity
    P_Negative_given_Covid = 1 - sensitivity
    P_Negative_given_notCovid = specificity
    P_Covid_given_Positive = (P_Positive_given_Covid * P_Covid)/((P_Positive_given_Covid * P_Covid)+(P_Positive_given_notCovid * P_notCovid))
    P_Covid_given_Negative = (P_Negative_given_Covid * P_Covid)/((P_Negative_given_Covid * P_Covid) + (P_Negative_given_notCovid * P_notCovid))
    # Return the results as a tuple
    return P_Covid_given_Positive, P_Covid_given_Negative
I can then use the function to investigate how I should interpret my test results given different sensitivities and specificities for tests as well as information about my baseline risk.
Just show me the pictures!
Okay, okay, I want to use some fairly representative numbers. There’s a sensible-looking paper in Thorax by Flower et al. that includes sensitivity and specificity estimates for a range of tests. Based on this, most tests appear to be very specific (99% or better), but sensitivity is much more variable. The worst look to be around 50% sensitive, but there are some were sensitivity is looking to be more like 90%.
Using the code above, I can plot graphs showing my results pretty easily. Again, the code is below in case it’s of use.
# Start out by putting in the sensitivity and specificity of your test
sensitivity = 0.9
specificity = 0.99

from matplotlib import pyplot as plt

# Generate some data to plot based on a range of possible priors
prior_list = []
positive_result = []
negative_result = []
for i in range(1000):
    prior_list.append(i/1000)
    result = TestResult(sensitivity, specificity, i/1000)
    positive_result.append(result[0])
    negative_result.append(result[1])

# Plot the results
plt.plot(prior_list, positive_result, label = "Probability of having Covid with a positive test")
plt.plot(prior_list, negative_result, label = "Probability of having Covid with a negative test")
plt.xlabel('Baseline risk of having Covid')
plt.ylabel('Likelihood of having Covid after test result')
plt.legend(loc='center',fancybox=True, shadow=True, framealpha=0.5)
plt.show()
This is what it looks like if I’m using a test that is only 50% sensitive:
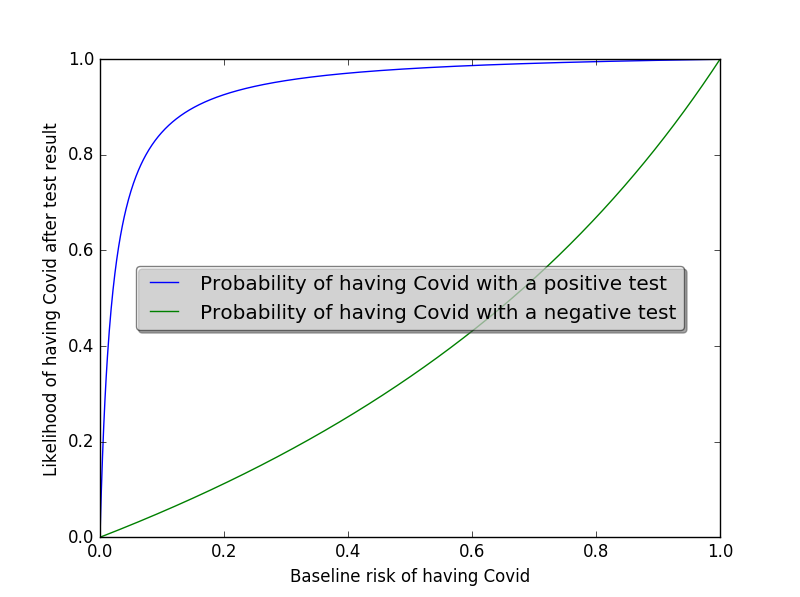
In reality, we’re probably going to choose one of the better performing tests. Around 85% sensitivity seems more plausible. That is, the test would detect Covid in 85 out of every 100 people with Covid. In this scenario, the plot looks like this:
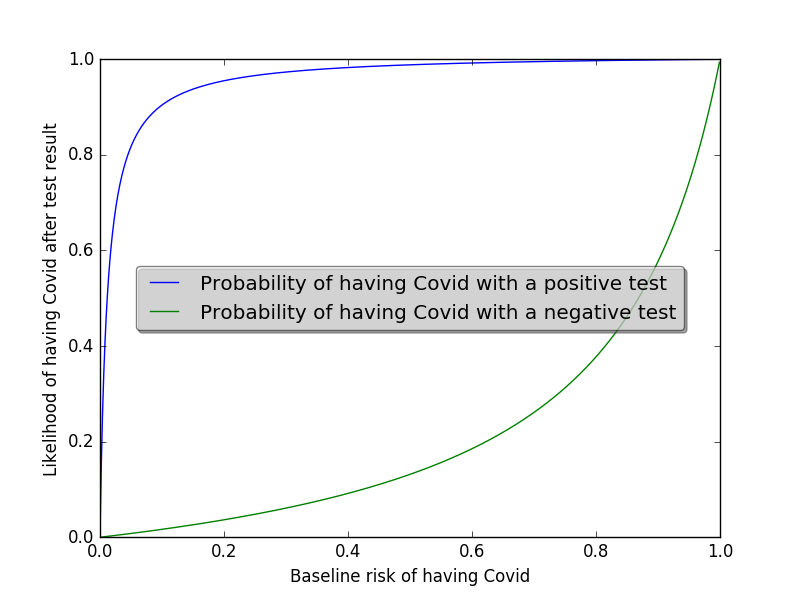
On this second plot, you can see that the shape of the green line has changed quite a lot. It’s more concave, meaning that the risk of the the test missing a Covid case increases more slowly as the baseline risk of illness (i.e. the rate in the population) increases.
Graphs are good, but also bad!
I like graphs. If you know what you’re interpreting, they’re great. However, most people will struggle with making sense of them, particularly as we’ve already established that many people will have no idea what their baseline risk is. Fortunately, we can use our function to produce results in a different way by referring back to the ONS data on baseline risk. The code below can be adjusted to print out interpretations of data in different areas. Crucially, it includes the uncertainty around estimates of baseline risk.
# Change these to the sensitivity and specificity of the test you are using and add the ONS estimate for case rate in your area
sensitivity = 0.9
specificity = 0.99
ONSEst_low = 0.009301286002204270
ONSEst_high = 0.015954160556545300
low_result = TestResult(sensitivity, specificity, ONSEst_low)
high_result = TestResult(sensitivity, specificity, ONSEst_high)

print('In this area, we believe that between 1 in every '+str(round(1/ONSEst_high))+' to '+str(round(1/ONSEst_low))+' people in the community have Covid.')
print('Given that, between '+str(round(low_result[0]*100))+' and '+str(round(high_result[0]*100))+ ' out of every 100 people with a positive test will have Covid.')
print('Of the people who get a negative test result, 1 in every '+str(round(1/high_result[1]))+' to '+str(round(1/low_result[1]))+ ' people are expected to actually have Covid.')
For example, the numbers in the box above capture the results for a high quality test (90% sensitive, 99% specific) in Yorkshire and the Humber on 16th January. The results are:
In this area, we believe that between 1 in every 63 to 108 people in the community have Covid.
Initial interpretation of the results of a high-quality test in a relatively low prevalence area
Given that, between 46 and 59 out of every 100 people with a positive test will have Covid.
Of the people who get a negative test result, 1 in every 612 to 1055 people are expected to actually have Covid.
That doesn’t look like a particularly useful test. What happens if we change the area to London, where the base rate of illness was higher? Let’s see:
In this area, we believe that between 1 in every 31 to 39 people in the community have Covid.
Initial interpretation of the results of a high-quality test in a relatively high prevalence area
Given that, between 70 and 75 out of every 100 people with a positive test will have Covid.
Of the people who get a negative test result, 1 in every 295 to 379 people are expected to actually have Covid.
This makes the test look rather more useful.
This is a decent start, and it highlights three important features of testing:
- The value of testing depends a lot on the risk in the group being tested
- If the rates in your area are very low, a high proportion of positive tests will be false positives even if the test is good (this does not mean that you will get a lot of false positives – more on this in a minute)
- You will miss some people who have illness, and the number you miss will depend on rates in your area
Now for something really simple
Most of you will have found the Bayesian stuff a bit tricky. It’s worth it to get some nice natural numbers that we can use to talk to people, but there are some numbers missing.
If I were in charge of a business about to use lateral flow kits, I’d want to know things like:
- How many of my staff have Covid?
- How many will this kit identify?
- How many will it miss?
- How many people are going to end up isolating unnecessarily (i.e. what’s the cost)?
The good news is that we can answer these even more simply. In fact, you can do it on the back of an envelope using the sensitivity and specificity and the ONS data (or whatever is available in your area).
Here’s some example code for discussing a program with an employer of 200 people using a relatively high quality test in a relatively high risk area:
number_staff = 200
rate_in_area = 0.028937488140698600
sensitivity = 0.9
specificity = 0.95

# Calculate relevant values
number_covid = round(number_staff * rate_in_area)
number_no_covid = number_staff - number_covid
covid_pos_test = round(number_covid * sensitivity)
covid_neg_test = number_covid - covid_pos_test
no_covid_pos_test = round((1-specificity)*number_no_covid)
no_covid_neg_test = number_no_covid - no_covid_pos_test

print('Of your '+str(number_staff)+' staff, we estimate that around '+str(number_covid)+' have Covid. Of these, we would expect to identify '+str(covid_pos_test)+'.')
print('Of the '+str(number_no_covid)+' without Covid, we would expect around '+ str(no_covid_pos_test)+' to have to isolate unnecessarily.')
This gives the following results:
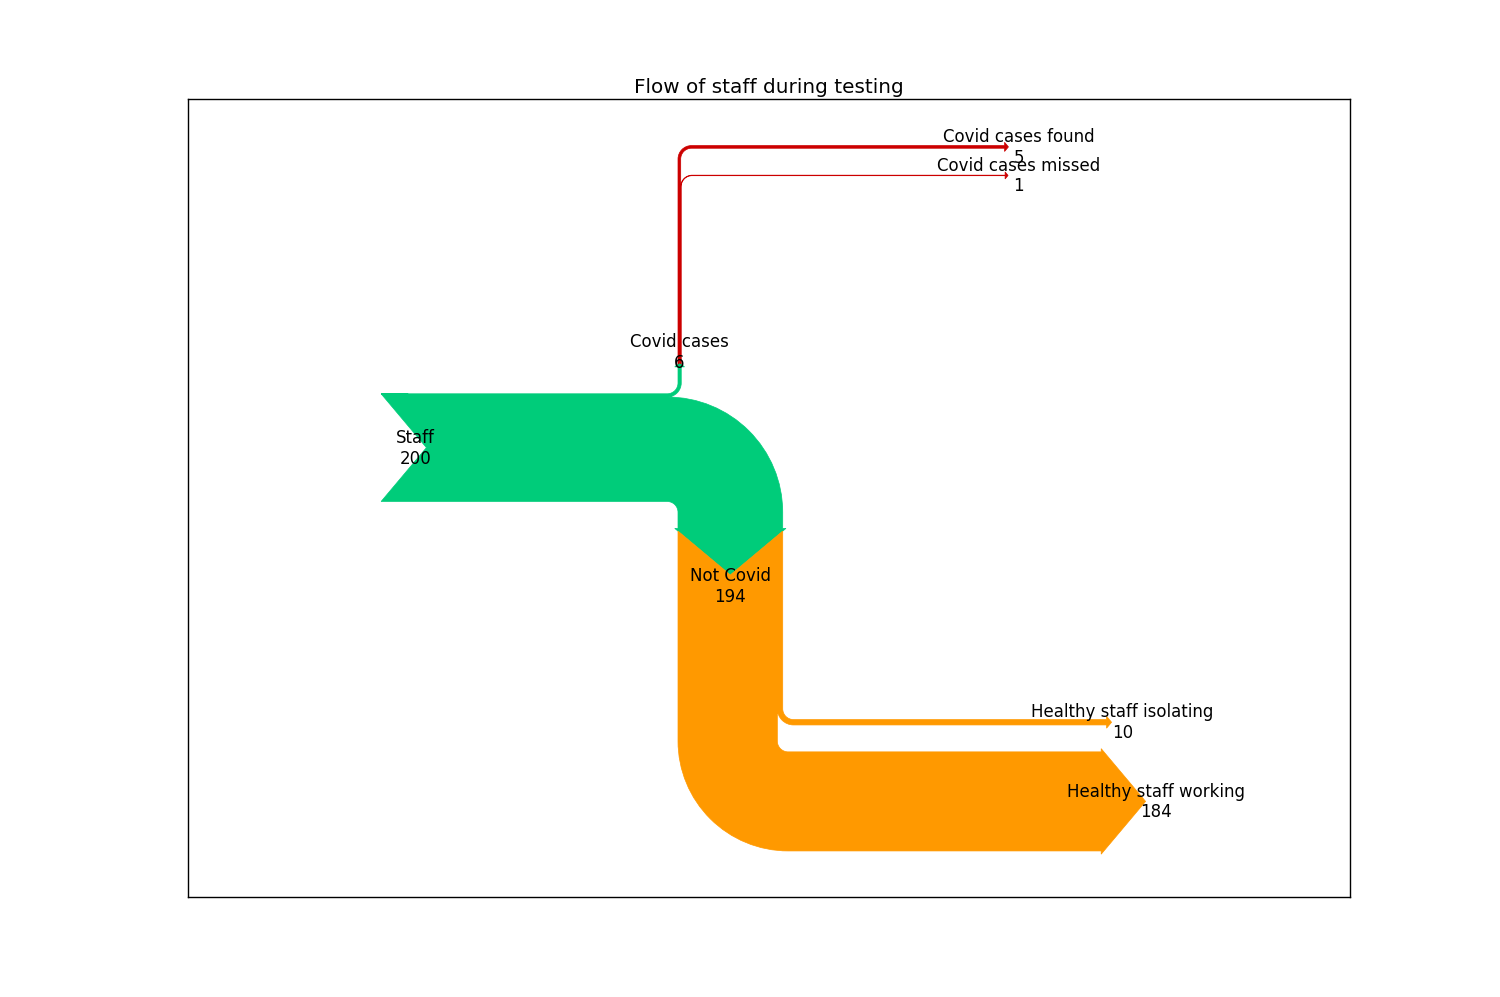
Of your 200 staff, we estimate that around 6 have Covid. Of these, we would expect to identify 5.
Expected outcome for an employer of 200 people using a high-quality test in a relatively high prevalence area
Of the 194 without Covid, we would expect around 10 to have to isolate unnecessarily.
Here’s a diagram of the same data showing where the values have come from (click to enlarge):
Putting it all together
I’m sure you can see that there’s potential value in being able to add a sense of scale to these risk estimates that people can make sense of. It’s immensely difficult to make rational decisions without a clear handle on the risk. Tools like Bayesian statistics and simple flow diagrams can make really tough decisions more transparent.